
Faster growth or greater security?
29 oct 2012The risk-reward trade-off of investing in the Growth-8 economies
One of the most interesting aspects of our recent Global Dynamism Index (GDI) was the strong performance of mature economies. It was a result Ed Nusbaum described as counterintuitive in that the word dynamism tends to be attributed to faster growing emerging markets such as the BRIC economies.
The father of the ‘BRIC’ acronym, Jim O’Neill of Goldman Sachs, now highlights the ‘Growth-8’ economies – Brazil, China, India, Indonesia, Korea, Mexico, Russia and Turkey – as being the key drivers of global growth over the next few years.
Their forecast growth rates are certainly impressive. In the period 2012-17, the IMF expects them to account for 47% of global growth, catapulting all eight into the world’s largest twenty economies.[1]
But do these rapidly expanding economies offer the best growth environments for dynamic businesses?
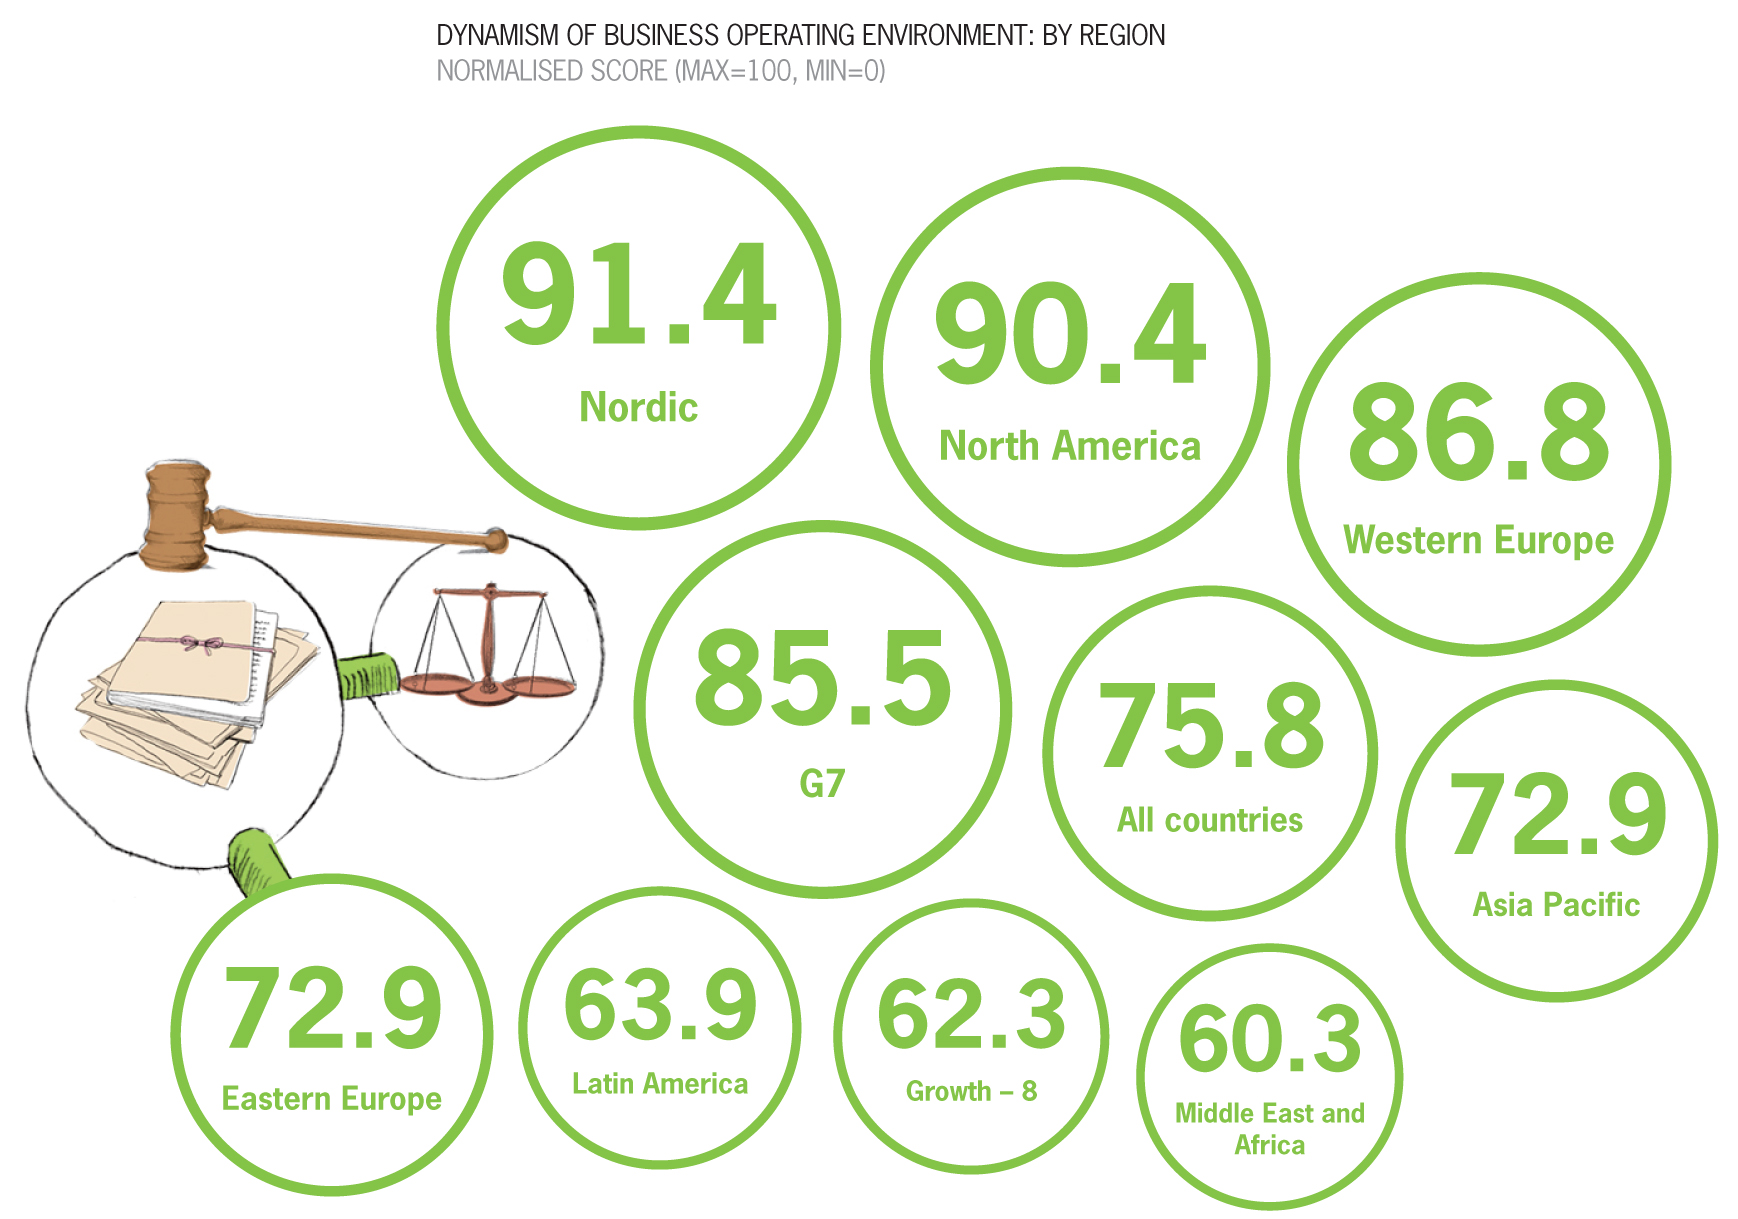
According to the GDI, the answer is no. The Growth-8 economies scored 55.0[2] for the overall dynamism of their economies, below the global average (57.3) and well behind the G7 (59.6). The Growth-8 come out on top in terms of the dynamism of their economics & growth, but they come third bottom in science & technology, second bottom in business operating environment, and bottom overall in financing environment.
Individually, Korea – the most advanced of the eight – ranks in the top ten and China sits in 20th place, but the remaining six rank in the bottom half of the 50 economy index. India, Indonesia and Russia sit in the bottom ten.
Of course the GDI is far more than simply another measure of growth. By considering key drivers of business location decisions such as political stability, IT infrastructure and access to finance, the index gives a much more rounded picture of the potential challenges of operating in different markets.
The key question for business leaders considering investing in the Growth-8 economies is whether the potential rewards outweigh the risks.
[1] IMF 2012
[2] Modelling the indicators and categories results in scores of 0-100 for each country, where 100 represents the most dynamic environment and 0 the least.